2021
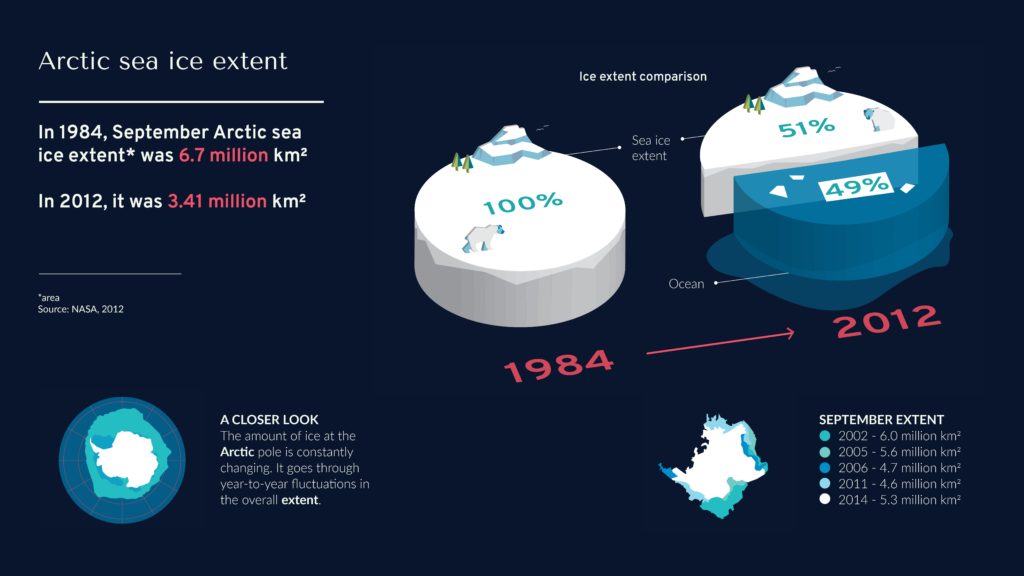
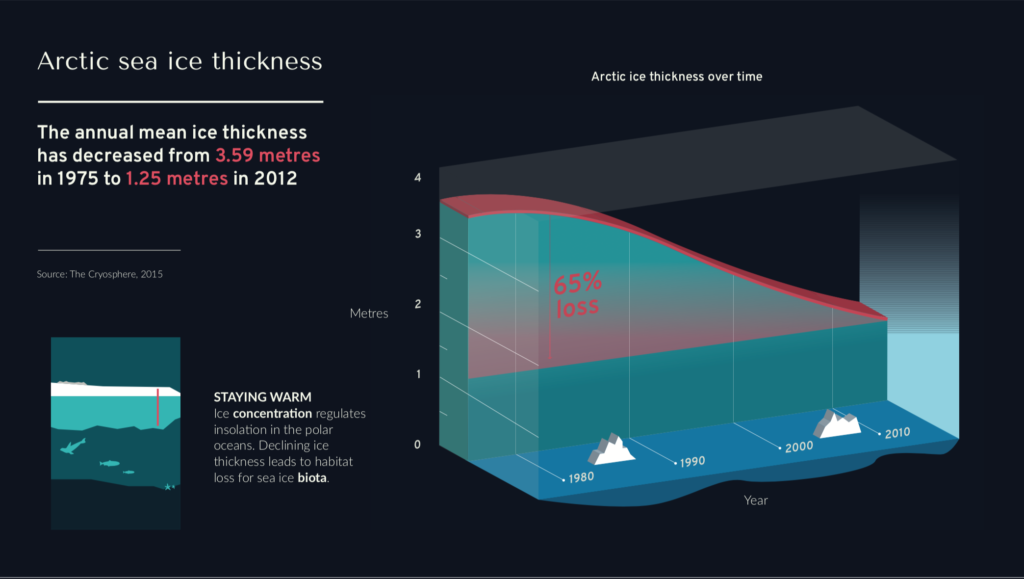
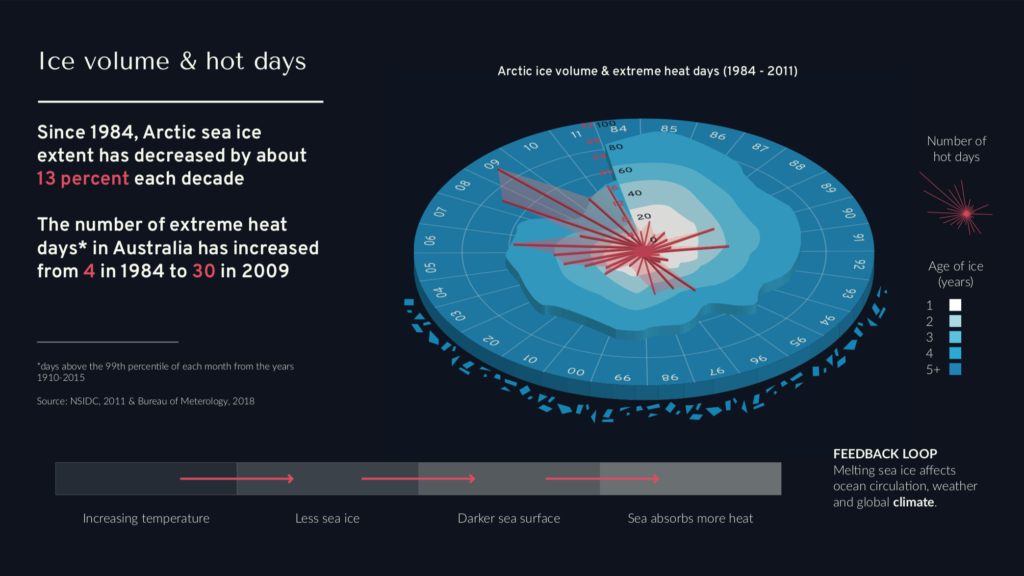
For a university course about visualising climate change, I created a series of infographics to depict Arctic sea ice loss.
I sourced current data about the issue before designing all the elements in Illustrator. I chose to give the graphs depth through an isometric view which, aided by my illustrations of ice caps and polar bears, makes the information easier to understand.
I envisioned the large-scale infographics presented in a museum space to leave a lasting impact on the viewer, and to more broadly showcase the power of design to communicate often complex or overwhelming issues.